 (image credit: Generated by AI)
Background
- Despite its rich tradition of shipbuilding, a well-established ship-building ecosystem, and a favourable geographic location, India currently ranks 16thin the global shipbuilding industry with a paltry 0.06% share in the global shipbuilding market that is dominated by China, Japan, and South Korea, which taken in aggregate, account for 95% of the global market-share.[1] Similarly, in the case of ship-repair industry – a market that is expected to reach more than USD 40 billion by 2030 — India’s share is less than one per cent.[2] In this case, the market is dominated by shipyards in China, Singapore, Korea and West Asia, largely due to the availability of skilled workforce and induction of latest technology. However, the Government of India’s maritime vision (Maritime India Vision 2030 and Maritime Amrit Kaal Vision 2047) seeks to radically transform India’s shipbuilding and ship-repair industry. It envisions Indian ship-building becoming competitive and achieving high volumes of production to reach “Make in India, Make for World” levels, and being one of the top 10 shipbuilding nations in the world.[3] This leap from the current 16th position to the 10th position (at least) entails a four-fold increase in production from 40923 GT to 160460 GT.[4] In the case of the ship-repair industry, the Government of India seeks to increase India’s market from the current ₹ 2,000 crore level to a ₹ 14,000 crore-plus level in the next ten years, a seven-fold[5] It is apparent that this transformation will require a substantial impetus in terms of policy as well as in areas such as financing, the identification of new market opportunities, HR development, etc. As such, these are issues that must be addressed collectively by the Government of India and the shipbuilding industry, which is the most important stakeholder in this transformation.
- This article makes a case for an offshoring strategy for enhancing India’s shipbuilding and ship-repair (SBSR) industry as a measure that complements the main line-of-effort of increasing domestic SBSR capacity by way of improving efficiencies, capturing domestic market, and addition of capacity. Towards this, the article broadly explores the status of India’s existing SBSR industry and assesses the impact of policies that support it. It also surveys the global SBSR industry and seeks to gain insights from the strategies of major shipbuilding countries. The article concludes that offshoring of shipbuilding industry is a viable measure to increase national output and recommends it as a complementary strategy for India.
Status of India’s SBSR Industry
- Financial-Support for SBSR Industry. Admittedly, substantial research has been carried out over past several years by various agencies to identify measures for boosting India’s SBSR industry. This research has then informed policy-making, resulting in a number of incentives by the government to Indian shipyards. At a fundamental level, growth in India’s shipbuilding and ship-repair industry requires two things: (a) an increase in total shipbuilding capacity and efficiency, and (b) increase in orders from clients. Consequently, the government’s policies have targeted these two aspects. As far as increasing the capacity of shipbuilding is concerned, the Government of India (GoI) had introduced the Ship-Building Financial Assistance Policy (2016-2026) to encourage domestic shipbuilding and to provide a level playing field vis-a-vis foreign shipyard. Towards this, the government had pledged to provide financial assistance up to 20 per cent[6] of the contract price[7] of a ship to the shipyard.[8] This Shipbuilding Financial Assistance Scheme was extended in September 2025 until 31st March 2036 with a total corpus of Rs 24,736 crore.[9] In addition, the government has also approved a Maritime Development Fund (MDF) with a corpus of Rs 25,000 crore to provide long-term financing for the sector. This includes a Maritime Investment Fund of Rs 20,000 crore with 49 per cent participation from the GoI and an Interest Incentivization Fund of Rs 5,000 crore to reduce the effective cost of debt and improve project bankability. A third initiative, that targets increasing the capacity of shipyards, is the Shipbuilding Development Scheme (SbDS) with a budgetary outlay of Rs.19,989 crore, which aims to expand domestic shipbuilding capacity to 4.5 million Gross Tonnage (GT), support mega shipbuilding clusters, infrastructure expansion, establish the India Ship Technology Centre under the Indian Maritime University, and provide risk coverage, including insurance support for shipbuilding projects. As such, the shipbuilding, ship repair and IWT sector have been declared ‘Infrastructure’ by the GoI and are therefore entitled to long term, low-cost funds.[10]
- Policy-Support for Increasing Domestic Market Share. Capturing domestic market share by Indian shipbuilders is a major challenge, and a focus area of the GoI. In 2024, the share of overseas cargo carried by Indian Flag Vessels was merely 5.33 per cent,[11] indirectly implying an aversion by Indian ship owners towards domestic shipbuilders. Some sources also indicate that roughly 40 per cent of Indian merchant fleet is built in Indian shipyards.[12] This situation of low figures of Indian-built (and Indian-owned and Indian-flagged) ships is envisaged to be corrected through certain policy initiatives. The increase in orders from clients, for instance, is sought to be achieved indirectly by introducing a Right of First Refusal (ROFR) by Indian-built and Indian-owned ships as a condition for chartering of vessels through tender process. By prioritising Indian built, Indian flagged and Indian owned vessels in the tender-process, this policy aims to encourage charterers to choose Indian-built ships, thereby spurring demand for such ships. Although earlier government policy also prioritised Indian-flagged vessels, it was reviewed in 2020 specifically in favour of ‘Indian-built, Indian-flagged, and Indian-owned vessels’.[13] Subsequent amendments to this policy have since been carried out.
- Number of Shipyards. The Standing Committee of the Parliament on Transport, Tourism, and Culture, in its 368th report (presented on 08 February 2024) entitled, “Status of Shipbuilding, Ship Repair and Shipbreaking industries in the Country” noted that that there are 45 Shipyards in the country, 7 under Central Public Sector, 2 under State Governments and 36 under private sector. However, the MoPSW’s “Statistics of India’s Ship Building and Ship Repairing Industry 2023-24” reports a total of 41 shipyards, of which three have closed down and five have not reported information for the year 2023-24.[14] Therefore, this article considers the following 26 shipyards which have produced at least one ship/ craft in the last six years:
| Name of Shipyard | 2019 | 2020 | 2021 | 2022 | 2023 | 2024 | ||||||||
| No. | DWT (‘000) | No. | DWT (‘000) | No. | DWT (‘000) | No. | DWT (‘000) | No. | DWT (‘000) | No. | DWT (‘000) | |||
| CSL | 3 | 0.15 | 16 | 1.03 | 13 | 2.29 | 12 | 36.47 | 14 | 2.88 | 7 | 0.34 | ||
| GRSE | 4 | 0.71 | 4 | 0.85 | 3 | 0.33 | 0 | 0 | 1 | 0.06 | 2 | 1.4 | ||
| GSL | 3 | 2 | 1 | 0.46 | 2 | 0.92 | 3 | 0.94 | 1 | 0.03 | 12 | 0.04 | ||
| HSL | 6 | 0.4 | 5 | 0.2 | 1 | 3.35 | 4 | 0.51 | 3 | 0 | 0 | 0 | ||
| HDPE(CSL) | 0 | 0 | 0 | 0 | 0 | 0 | 0 | 0 | 2 | 0.17 | 0 | 0 | ||
| MDL | 0 | 0 | 1 | 0 | 1 | 0 | 2 | 0 | 2 | 0 | 1 | 0 | ||
| Shalimar | 1 | 0.05 | 0 | 0 | 2 | 0.6 | 1 | 0.01 | 4 | 0 | 1 | 0.51 | ||
| Udupi | 0 | 0 | 0 | 0 | 0 | 0 | 2 | 0.02 | 9 | 0.14 | 9 | 0.42 | ||
| A.C.Roy | 2 | 1.01 | 17 | 0.6 | 1 | 0.1 | 0 | 0 | 8 | 0.76 | 6 | 0.57 | ||
| AH Wadia | 0 | 0 | 0 | 0 | 2 | 0.01 | 18 | 0 | 86 | 0 | 110 | 0 | ||
| Bristol Boats | 0 | 0 | 2 | 0.002 | 8 | 0 | 11 | 0 | 3 | 2.05 | 0 | 0 | ||
| Chowgule | 2 | 0 | 5 | 8.44 | 4 | 8.44 | 3 | 8.44 | 6 | 2.5 | 1 | 5.42 | ||
| Dempo | 3 | 0.1 | 0 | 0 | 1 | 0.74 | 0 | 0 | 0 | 0 | 1 | 0.03 | ||
| L&T | 1 | 1.91 | 0 | 0 | 0 | 0 | 10 | 0 | 5 | 0 | 0 | 0 | ||
| Mandvi | 4 | 12.97 | 7 | 9.7 | 7 | 5.57 | 5 | 4.62 | 14 | 13.4 | 8 | 6.94 | ||
| Marine Frontiers | 4 | 0.03 | 0 | 0 | 0 | 0 | 0 | 0 | 0 | 0 | 0 | 0 | ||
| Modest | 0 | 0 | 1 | 0.4 | 1 | 1.66 | 6 | 0.14 | 7 | 0.59 | 2 | 0.64 | ||
| Neptunus | 0 | 0 | 0 | 0 | 0 | 0 | 0 | 0 | 3 | 0 | 5 | 0 | ||
| Patra | 0 | 0 | 0 | 0 | 1 | 0.02 | 3 | 0 | 0 | 0 | 0 | 0 | ||
| San Marine | 0 | 0 | 0 | 0 | 5 | 1.36 | 7 | 10.29 | 10 | 3.63 | 0 | 0 | ||
| Sea Blue | 0 | 0 | 14 | 5 | 6 | 1.3 | 16 | 45.16 | 17 | 5.4 | 0 | 0 | ||
| Sadbhav | 0 | 0 | 0 | 0 | 0 | 0 | 0 | 0 | 0 | 0 | 1 | 0.04 | ||
| Shoft | 3 | 2.43 | 0 | 0 | 3 | 0.08 | 8 | 0.2 | 5 | 0.3 | 11 | 0 | ||
| Titagarh | 3 | 2.78 | 3 | 1.67 | 1 | 0.19 | 0 | 0 | 2 | 0.53 | 5 | 0.07 | ||
| Vijay Marine | 1 | 0.2 | 2 | 2.9 | 7 | 0.86 | 0 | 0 | 4 | 0.1 | 7 | 9.4 | ||
| Waterways | 0 | 0 | 0 | 0 | 1 | 2.5 | 4 | 2.86 | 0 | 0 | 6 | 1.2 | ||
| Total | 41 | 24.74 | 78 | 31.25 | 70 | 30.32 | 115 | 109.66 | 206 | 32.54 | 195 | 27.02 | ||
Table 1.1: Indian Shipyards That Have Produced At Least One Vessel in the last Six Years (2019-24)
Notes:
(a) The data in Table 1.1 has been compiled from the annual shipbuilding statistics reports published by the Transport Research Wing (TRW) of MoPSW.
(b) Most shipyards report only the number of ships, and not the DWT in their figures. Therefore, a direct comparison of DWT with the number of ships built can be misleading.
- Impact of Supportive Policy Measures on Indian Shipbuilding Industry. An examination of Indian shipbuilding industry in the last ten years would offer an insight on whether the supportive measures by the government have been adequate to enhance its capacity. The report of the Standing Committee of the Parliament on Transport, Tourism, and Culture, cited earlier, noted that “India’s share in the global ship building and ship repair market remains meagre, hovering around 1-2%. In fact, India’s position in both sectors has witnessed a decline in the past decade.”[15] The Committee also observed that a mere 6 to 7 per cent of the Rs 4000 crore corpus (which is equal to Rs 269 crore) allocated for the Shipbuilding Financial Assistance Scheme had been utilised in six years (2019 to 2024) and that the targets set by the MoPSW appeared “rather unrealistic”.[16]
- Enhancing Domestic Shipbuilding Capacity. The total ship-building capacity of Indian shipyards as on 01 January 2024 stood at 311160 DWT.[17] This is shown in Figure 1.1.
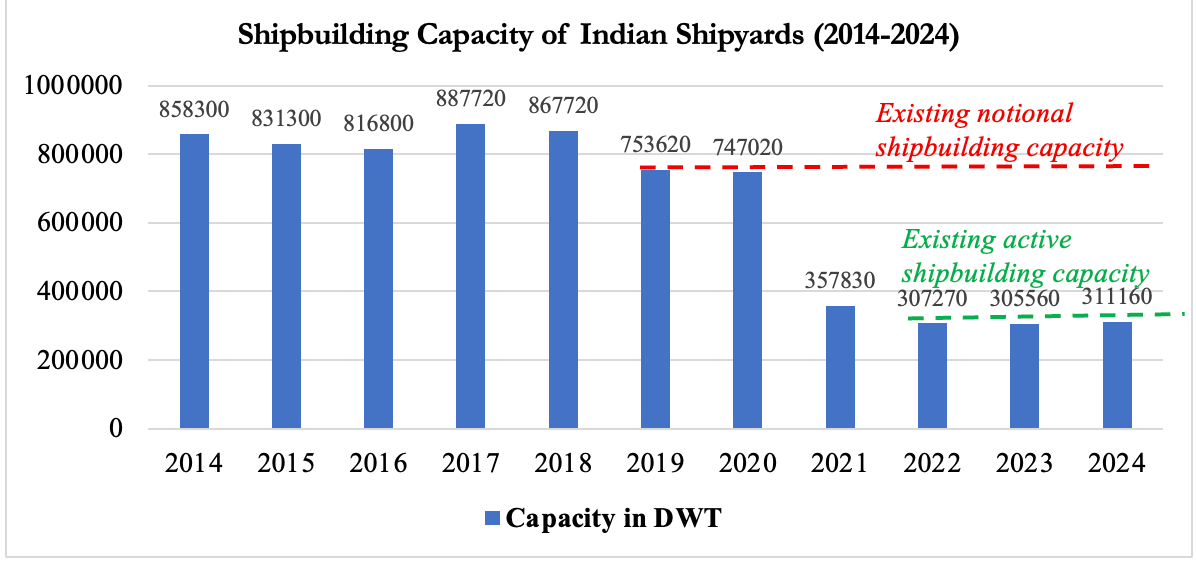 Figure 1.1: Capacity of Indian Shipyards (2014-2024) in DWT[18]
- The data presented in Figure 1.1 poses a fundamental problem in analysis of Indian shipbuilding industry because GT and not DWT is the appropriate measure of shipbuilding capacity. In fact, the most accurate measure of shipbuilding capacity is the Compensated Gross Tonnage (CGT), published by the OECD Council Working Party on Shipbuilding (WP6).[19] The latest edition of this publication was revised in 2006 following a proposal submitted by shipbuilder associations to replace the then existing compensated gross ton (cgt) system, which was sponsored by the OECD since the 1970s, and which was last revised in 1994.
- There is no formula for converting DWT to GT accurately, and vice versa, because these two units measure entirely different attributes – DWT measures the cargo carrying capacity of a vessel, whereas GT measures its total internal volume. Nevertheless, rough rules-of-thumb do exist that allow approximate conversions.[20] Using the equivalence of 1 GT = 1.7 DWT, the total shipbuilding capacity of Indian shipyards would be 183035 GT. Clearly, therefore, increasing the existing capacity to 4.5 million GT by 2047 appears to be unrealistic as it requires shipbuilding capacity to grow by a multiple of 25, which would require huge capital investment, creation of a substantial manpower pool (which could take several years), acquisition of land (including on the waterfront), creation of a whole range of ancillary and feeder industries, and a corresponding need for raw material. The target of 4.5 million GT by 2047 (and even 500,000 GT by 2030) also appears challenging in view of the fact that India’s shipbuilding capacity has shown a declining trend in the last ten years.
- It must, however, be acknowledged that the decline in India’s shipbuilding capacity in the last decade is a purely technical view that emerges from data presented in official publications. It does not consider several factors such as problems associated with individual shipyards, including insolvency and technological issues. This could result in misleading conclusions because while several of the dry-docks, ship-lifts, and slipways belonging to insolvent yards, which are currently lying idle, are removed from the total shipbuilding capacity in a given year, the fact remains that these capacities continue to exist, albeit unutilised. Swan Defence shipyard, which has a capacity of 400000 DWT, is a case in point. This shipyard was removed in 2020 from the list (Figure 1.1), resulting in a sharp decline in total shipbuilding capacity. However, it is likely that it would again be included in the list of active shipyards given that it has signed a USD 227 million contract for six chemical tankers with Rederiet Stenersen AS. [21]
- Order-Books and Deliveries of Indian Shipyards. A related and significant question that arises in this connection is whether there would be a market for Indian shipyards as and when an ambitious target of 4.5 million GT shipbuilding capacity is achieved. Tables 1.2 and 3 present data on the order book of Indian shipyards and the deliveries made by them, respectively, between FY 2016-16 and FY 2023-24.
|
Year |
Public Shipyards | Private Shipyards | Total No of Ships on Order | Total DWT on Order | Max Capacity of Indian Shipyards in that year | Order Book as % of capacity in DWT | ||
| Order Book | Order Book | |||||||
| No of ships | DWT | No of ships | DWT | |||||
| 2023-24 | 168 | 293840 | 242 | 307240 | 410 | 601080 | 311160 | 193.2 |
| 2022-23 | 125 | 134550 | 308 | 115390 | 433 | 249940 | 305560 | 81.8 |
| 2021-22 | 130 | 103760 | 208 | 105270 | 338 | 209030 | 307270 | 68 |
| 2020-21 | 125 | 56240 | 155 | 222660 | 280 | 278900 | 357830 | 78 |
| 2019-20 | 128 | 69290 | 121 | 49010 | 249 | 118300 | 747020 | 15.8 |
| 2018-19 | 111 | 123680 | 77 | 48060 | 188 | 171740 | 753620 | 22.8 |
| 2017-18 | 69 | 148630 | 162 | 852830 | 231 | 1001460 | 867820 | 115.4 |
| 2016-17 | 78 | 206740 | 170 | 1982070 | 248 | 2188810 | 887720 | 246.5 |
| 2015-16 | 104 | 173070 | 192 | 2568980 | 296 | 2742050 | 816800 | 335.7 |
Table 1.2: Order Book of Indian Shipyards (2016-2024)
|
Year |
Public Shipyard
Deliveries |
Private Shipyard
Deliveries |
Total No of Ships Delivered | Total DWT Delivered | Max Capacity of Indian Shipyards in that year | Deliveries made as % of DWT | ||
| No of ships | DWT | No of ships | DWT | |||||
| 2023-24 | 32 | 2710 | 163 | 26300 | 195 | 29010 | 311160 | 9.4 |
| 2022-23 | 36 | 3260 | 170 | 29270 | 206 | 32530 | 305560 | 9.0 |
| 2021-22 | 24 | 37940 | 89 | 71730 | 113 | 109670 | 307270 | 14.6 |
| 2020-21 | 22 | 7490 | 47 | 22790 | 69 | 30280 | 357830 | 4.0 |
| 2019-20 | 27 | 2540 | 51 | 28720 | 78 | 31260 | 747020 | 3.6 |
| 2018-19 | 17 | 3310 | 24 | 21460 | 41 | 24770 | 753620 | 2.8 |
| 2017-18 | 15 | 5010 | 49 | 105350 | 64 | 110360 | 867820 | 13.5 |
| 2016-17 | 23 | 47450 | 13 | 80540 | 36 | 127990 | 887720 | 14.4 |
| 2015-16 | 32 | 48510 | 23 | 94530 | 55 | 143040 | 816800 | 17.5 |
Table 1.3: Deliveries Made by Indian Shipyards (2016-2024)
- The shipbuilding capacity at end of FY 2023-2024 stood at 311160 DWT (Figure 1.1). Against this figure, the order book of Indian shipyards was 193 per cent of their total capacity (Table 1.2), which at first glance, reflects a shortage of capacity, and consequently suggests increasing the capacity of Indian shipyards. However, Table 1.3 indicates that a mere 10 per cent deliveries were made in that year. In fact, during the nine-year period represented in the tables, the average order book was 128 per cent of the total capacity while the deliveries were a mere 10 per cent of the same. Thus, the following deductions emerge:
12.1. Capturing orders from the market is not the major problem since the order books of shipyards have been consistently high.
12.2. The problem is more about shipyard efficiency, as Indian shipyards are able to deliver only a tenth of the total shipyard capacity. Admittedly, this macro view does not account for the possibility that a large shipyard might not be getting any orders, and is therefore lying underutilised while smaller shipyards with full orderbooks are struggling to deliver ships.
12.3. Since Indian shipyards are unable to deliver even 10 per cent of their rated capacity (whereas the most efficient ones such as HHI are reported to deliver as high as 85 per cent of their capacity), it is evident that expansion of shipbuilding capacity alone is unlikely to result in higher ship production in the country.
- Export Orders for Indian Shipyards. Table 1.4 below illustrates the percentage of export orders in the combined order book of Indian shipyards. It is seen from this table that exports have constituted a substantial part of the order book of Indian shipyards over the last nine years. In fact, in terms of DWT, export orders have comprised an average of 51 per cent of the Indian order book. In terms of the number of ships, exports have comprised an average 13 per cent of the order book, which also implies that export orders consisted of larger ships.
|
Year |
Total Order Book | Export Orders | Exports as % of Total Orders | |||
| No of Ships | DWT | No of Ships | DWT | % of Ships | % of DWT | |
| 2023-24 | 410 | 601080 | 57 | 371150 | 14 | 61.7 |
| 2022-23 | 433 | 249940 | 35 | 146760 | 8 | 58.7 |
| 2021-22 | 338 | 209030 | 25 | 102420 | 7 | 49 |
| 2020-21 | 280 | 278900 | 19 | 188520 | 6.7 | 67.6 |
| 2019-20 | 249 | 118300 | 12 | 23340 | 4.8 | 19.7 |
| 2018-19 | 188 | 171740 | 14 | 31780 | 7.4 | 18.5 |
| 2017-18 | 231 | 1001460 | 50 | 588590 | 21.6 | 58.8 |
| 2016-17 | 248 | 2188810 | 64 | 1698480 | 25.8 | 77.6 |
| 2015-16 | 296 | 2742050 | 69 | 1358150 | 23 | 49.5 |
| Average number of ships/ DWT (%) | 13 | 51 | ||||
Table 1.4: Exports as Part of the Order Book of Indian Shipyards
A Scan of Global Shipbuilding Scenario
- As stated earlier in this report, almost all of global shipbuilding industry is concentrated in three countries, namely, China, South Korea, and Japan. In 2024, these three countries had a share of 54.5%, 28%, and 12% respectively. However, data from a single year does not faithfully capture shipbuilding trends because the shipbuilding output in consecutive years is likely to vary greatly, as is evident from the deliveries made by Indian shipyards in the last nine years (Table 1.3). Accordingly, the average performance of top-20 shipbuilding countries has been examined, as represented in Fig 1.2
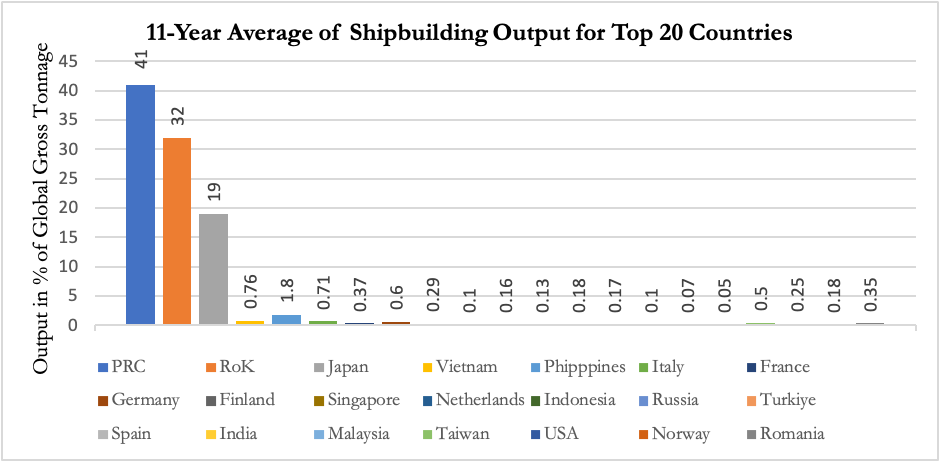 Fig 1.2: Shipbuilding Output of Top-20 Countries as % of Global Gross Tonnage
- It can be seen in Figure 1.2 that the global shipbuilding production in the last 11 years (2014 to 2024) was dominated by China, South Korea, and Japan, which together produced over 92 per cent of ships in the world. India’s share – not discernible in the figure – was 0.07 per cent at the 20th position, producing an average of 47,268 GT per year. It must be highlighted that the UNCTAD has positioned India among the Top-10 shipbuilding countries in its publication Review of Maritime Transport 2025; However, this contradicts the facts given in UNCTAD’s own database.[22]
- Global Shipbuilding Market. The global shipbuilding market, valued at USD 149.12 billion in 2024 is expected to grow at a compound annual growth rate (CAGR) of 4.06 per cent over the forecast period from 2024 to 2035[23], reaching ~USD 228 billion by the next decade. However, this is only a macro view of the market because for Indian shipbuilders, it is important to know the specific market for specific types of ships which could then enable them to formulate strategies to penetrate these markets. Several aspects must be considered in this regard:
16.1. Composition of Mercantile Fleet. Composition of merchant fleet is an important factor in the formulation of ship building and ship repair (SBSR) strategy. As of 01 January 2025, the composition of global merchant fleet was as depicted in Figure 1.3 below.
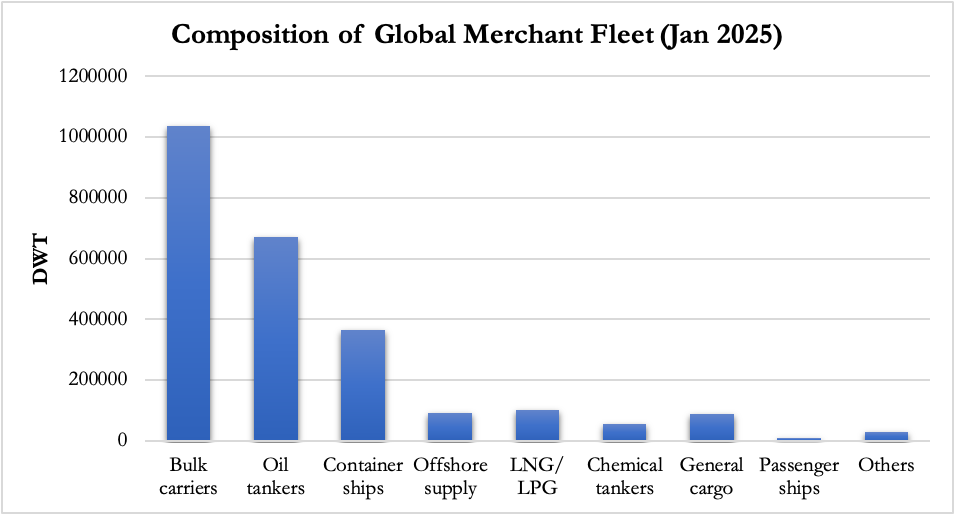 Fig 1.3: Composition of Global Merchant Fleet (Jan 2025)[24]
14.2. Growth of Global Merchant Fleet. The global merchant fleet has also grown substantially over the years. As Figure 1.4 below indicates, the growth has been especially high since 2010 and hardly slowed down during COVID-19. It may also be noted that the greatest growth has been in the number of ‘other’ ships, which includes gas carriers, OSVs, barges, tugs, etc even as bulk carriers too have seen a robust growth of 148%, followed by containers ships (115%).
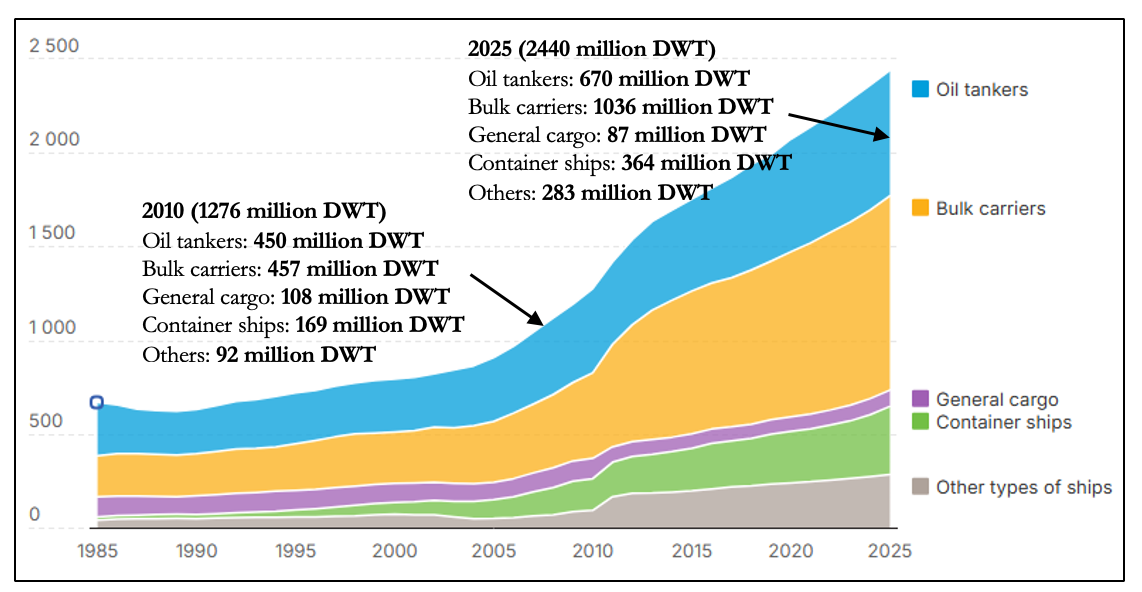 Fig 1.4: Growth of Global Merchant Fleet (1985 to 2025)[25]
14.3. Ownership. Another factor in assessing opportunities in shipbuilding markets is ownership – that is, “who is buying ships?”. As per UNCTAD, over half of the world’s shipping fleet is concentrated in five countries (Figure 1.5) with Greece owning 16.4 per cent.
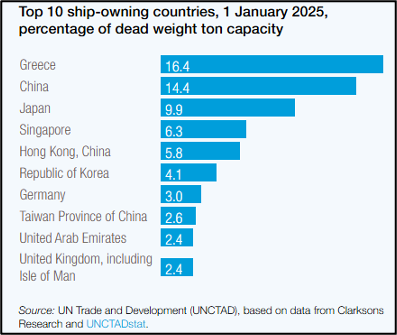 Fig 1.5: Top 10 Ship-owning Countries[26]
14.4. Age of Shipping Fleet. Another factor that influences shipbuilding strategies is the age of merchant fleet. Normally, shipbuilding industry experiences cyclical growth and regression. According to one source, shipbuilding cycles have lasted 20-30 years, driven by the replacement-cycle of ships which usually have a lifespan of the same length. The last peak in global ship deliveries occurred in 2011, resulting in a large number of ships nearing retirement age now. Currently, roughly 53 per cent of ships in operation are over 20 years old. By 2030, this number is expected to reach 70 per cent. This trend will continue to drive the demand for fleet renewal.[27] For India, which aspires to develop its shipbuilding industry, the timing is particularly important. Having missed the 2021-25 “shipbuilding super-cycle”, India must now target the next peak in demand for new ships, which is likely to occur towards 2035. More importantly, the next peak in demand would be for ‘green ships’ for which Indian shipyards must prepare. Figure 1.6 below indicates the next peak in shipbuilding demand which is likely to occur by the middle of the next decade.
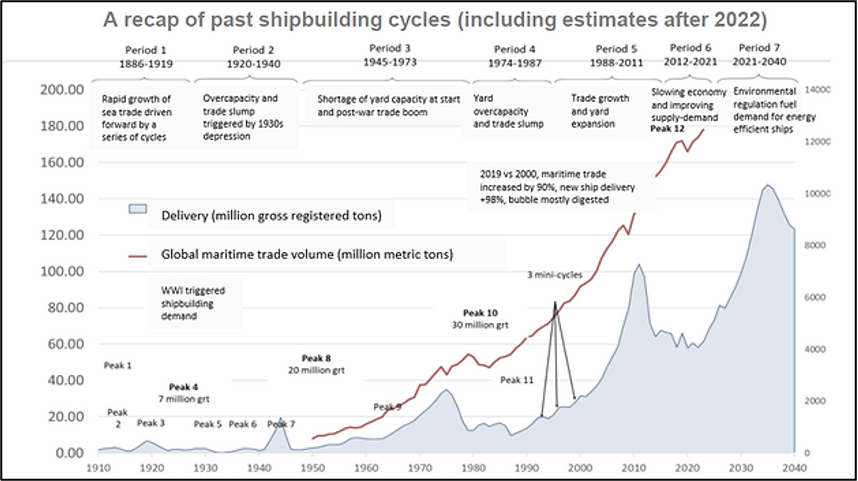 Fig 1.6: An Overview of Past Shipbuilding Cycles[28]
Need for Additional Measures to Boost Shipbuilding Sector in India: An Offshoring Strategy
- Although brief and abridged, the above analysis of Indian shipbuilding industry and the global shipbuilding market indicates that although the measures instituted by the GoI to boost shipbuilding have not had the desired effect thus far, there exists an opportunity to capitalise on the growing demand for ships. While a major expansion of existing Indian shipbuilding capacity and improving productivity of Indian shipyards are probably the surest ways of achieving the targets set out in the MAKV 2047, this study proposes that it is also essential to explore additional measures that would supplement the main line-of-effort. Towards this, the article advocates a Make by India, Make across the World strategy (as against Make in India, Make for the World) to enhance India’s shipbuilding capacity. Several major shipbuilders have adopted this strategy. For instance, UNCTAD’s Review of Maritime Transport 2025 notes that the three leading global shipbuilders – China, Japan and the Republic of Korea – face a mismatch between their respective capacity and shares of the global orderbook. To tide over this problem, the document notes that in 2024, the Government of the Republic of Korea set up a shipbuilding training centre in Indonesia, while shipbuilders in the Republic of Korea are also investing abroad and outsourcing production to China, the Philippines and Viet Nam to expand their production base.[29] South Korea’s Samsung Heavy Industries (SHI) outsourced construction of four Suezmax tankers to China’s Zhoushan shipyard in 2025, while its Hanwha Ocean shipyard was reportedly considering outsourcing to India.[30] Similarly, several other leading shipyards such as Hyundai (South Korea), Fincantieri (Italy), Tsuneishi (Japan), Damen (the Netherlands), and Naval Group (France), and Austal (Australia), etc have expanded their business activities overseas.
- Make by India, Make Across the World. This strategy encourages overseas investment by Indian shipyards (and other entities) in order to enhance India’s shipbuilding industry. The acquisition of a controlling stake by the Mazagon Dock Shipbuilders Ltd in Colombo Dockyard plc in 2025 is an innovative approach that offers a potentially fast-track means to achieve the goals set by the Government for India’s shipbuilding and ship-repair industry. Overseas investment — whether by way of investment in an existing shipyard or building a greenfield facility — is a promising strategy for growth of Indian shipyards. This is because of the following reasons:
18.1. The first reason is that, as noted in the Ministry of Ports Shipping and Waterways (MoPSW)’s Annual Report (2024-25), the “untapped potential in the Indian ship repair market can be attributed to the presence of competing international ship repair yards in Singapore, Middle East (Dubai, Bahrain) and Colombo on major trade routes and a capability gap of Indian yards in repairing certain kinds of vessels.” Therefore, the logical approach for India would be to take its business where it is needed. The new strategy suggests exactly such an approach, that is, establish ship-building and ship-repair (SBSR) business closer to potential clients.
18.2. The second reason is that — as also acknowledged in the same report of MoPSW — the GST (which is an additional tax burden) and other cost-related disadvantages such as the high cost of financing, lack of supply of ship spares in India and technology related issues which increase ship repair execution cycle, make Indian ship repairers uncompetitive as compared to foreign ship repairers. Offshoring, therefore, circumvents this issue. In fact, it also holds promise of benefitting from liberal financial policies adopted by many States.
18.3. A third reason is the potential capture of market share in the countries where such investments are made. Many smaller countries do not have shipyards, but they do need vessels of all kinds. By investing in such countries, Indian shipyards can capitalise on this yet untapped market.
18.4. Overseas investment in shipyards also has many intangible benefits such as brand-building of Indian shipbuilders, enhancing India’s ‘strategic footprint’ in areas where national interests lie, and creating dependencies for long-term sustained growth. Given India’s renewed maritime policy impetus by way of MAHASAGAR, shipbuilding and ship-repair are effective instruments with which to engage friendly foreign countries while simultaneously denying similar access to countries that are inimical to India.
18.5. Finally, partnering with foreign shipyards also offers opportunity to Indian shipyards to diversify their existing portfolio of ships. For instance, Colombo Dockyard has the ability to build cable-laying and cable-repair ships, which is a capability lacking among Indian shipyards. Similarly, certain shipyards excel in ship-conversion tasks, which in itself is an attractive business proposition.
Conclusion
- As a large maritime nation and one of the largest maritime economies of the world, India is well-positioned to capitalise upon the SBSR sector, which in turn would feed the shipping and its related sub-sectors. Yet, India’s shipbuilding industry has languished for a long while, and its market share in global shipbuilding is, as an author notes, “inversely proportional to the country’s size and population”.[31] There are several factors that contribute to the relatively low share of Indian shipbuilding, and many of these are being suitably addressed through policy measures by the GoI and through operational, financial, and administrative measures by other stakeholders. This article opines that although the primary thrust should be upon increasing the capacity and efficiency of Indian shipyards, offshoring of shipbuilding industry to enhance India’s shipbuilding output also merits consideration. The article, therefore, advocates a Make by India, Make across the World strategy (as against Make in India, Make for the World) to enhance India’s shipbuilding capacity.
About the Authors
Captain Ranendra S Sawan is a serving officer of the Indian Navy. He is a specialist in navigation, aircraft direction and naval operations, and is currently a Research Fellow at the National Maritime Foundation (NMF), where his research principally focusses upon the Indian Ocean, with specific reference to maritime facets of hard security. He may be contacted at pcrt2.nmf@gmail.com
Ms Junyali Gusain is a Research Associate at the National Maritime Foundation. She was awarded her BA (Hons) in Political Science with a minor in History from Maitreyi College, University of Delhi; and holds a Master’s degree in “Diplomacy, Law and Business”, with a specialisation in “Economics and Foreign Policy”, from OP Jindal Global University, Sonipat, Haryana. Her current research focuses upon the manner in which India’s own strategies in the Bay of Bengal and the Indo-Pacific are impacted by collectives such as BIMSTEC and IORA. She can be reached at irms5.nmf@gmail.com.
Endnotes:
[1] UNCTAD, Data Hub, “Ships built by country of building, annual (analytical)”, updated Jun 2025, https://unctadstat.unctad.org/datacentre/dataviewer/US.ShipBuilding
[2] Government of India, Ministry of Ports, Shipping, and Waterways, Annual Report 2024-25, pp. 54-55, https://shipmin.gov.in/sites/default/files/Annual%20Report%202024-25%20-%20English.pdf
[3] Ibid, p. 52.
[4] In 2024, Singapore was ranked at the 10th position with about 160,000 gross tonnage built (0.22% market share), while India was ranked at the 16th position with about 40,000 gross tonnage (0.06% market share).
[5] Ibid, p. 55.
[6] This rate of 20 per cent was reduced by 3 per cent every three years, and currently stands at 11 per cent at the end of FY 2025-26.
[7] This financial assistance is actually the lower of “Contract Price” or the “Fair Price” or the amount actually paid to the shipyard by the customer, for each vessel built by them.
[8] Maritime Amrit Kaal Vision 2047, p. 203
[9] Government of India, Press Information Bureau, ‘Comprehensive 4-Pillar Approach to Strengthen Shipbuilding, Maritime Financing, and Domestic Capacity’, 24 September 2025, accessed https://www.pib.gov.in/PressReleasePage.aspx?PRID=2170573®=3&lang=2
[10] Ministry of Ports, Shipping and Waterway, Government of India, Maritime Amrit Kaal Vision 2047, p. 209.
[11] Ministry of Ports, Shipping and Waterway, Government of India, Basic Port Statistics of India 2023-24, p. 7, https://shipmin.gov.in/sites/default/files/Revised%20Basic%20Port%20Statistics%20of%20India%202023-24%20%281%29.pdf
[12] Nikolaos Tagoulis, “India’s market share in the global shipbuilding”, Breakwave, 19 February 2025, https://www.breakwaveadvisors.com/insights/2025/2/19/indias-market-share-in-the-global-shipbuilding
[13] Government of India, Press Information Bureau, ‘To boost shipbuilding in India, Ministry of Shipping amends Right of First Refusal (ROFR) licensing conditions’, 22 October 2020, https://www.pib.gov.in/PressReleaseIframePage.aspx?PRID=1666728®=3&lang=2
[14] https://shipmin.gov.in/sites/default/files/SBR%202023-24%20%283%29.pdf
[15] Rajya Sabha Secretariat, 368th Report on ‘Status of Ship building, Ship Repair and Ship breaking industries in the Country’, p. 1, accessed https://sansad.in/getFile/rsnew/Committee_site/Committee_File/ReportFile/20/193/368_2024_2_14.pdf?source=rajyasabha
[16] As per the MoPSW Annual Report 2024-25 (see page 53), the cumulative financial assistance rendered under this scheme between 2018 and 2024 (seven years) was Rs 411.6 crore, for 152 ship-building projects.
[17] This figure is itself inaccurate as the MoPSW’s report does not include the shipbuilding capacities of some of the major shipyards such as MDL and GRSE. In earlier reports, GRSE reported its capacity as 550 DWT and MDL reported its capacity as 0.97 Effective Frigate Unit (EFU), and sometimes as 40,000 DWT. However, in the latest figures given I the 2023-24 report, both these shipyards have been excluded.
[18] The data in this graph has been sourced from the annual reports on Statistics of India’s Ship-Building and Ship-Repairing Industry published by the Transport Research Wing of the MoPSW, between the period 2014 to 2024.
[19] ‘A New Compensated Gross Ton System’, OECD, 25 October 2006, https://one.oecd.org/document/C/WP6(2006)7/En/pdf
[20] For tankers 1 GT = 1.75 DWT; bulkers 1 GT = 1.7 DWT; container carriers 1 GT = 1 DWT.
[21] It has been reported that Swan Defence and Heavy Industries (SDHI) has signed a $227 million contract for six chemical tankers with European shipowner Rederiet Stenersen AS. The company termed it as one of India’s largest single commercial shipbuilding orders and the first & the largest chemical tanker order awarded to an Indian shipyard. See https://economictimes.indiatimes.com/industry/transportation/shipping-/-transport/swan-defence-heavy-industries-bag-chemical-tanker-deal-worth-227-million/articleshow/127231476.cms?utm_source=contentofinterest&utm_medium=text&utm_campaign=cppst
[22] United Nations Trade and Development (UNCTAD), Review of Maritime Transport, p. 45, https://unctad.org/system/files/official-document/rmt2025ch2_en.pdf
[23] Spherical Insights, “Top 50 Companies in Shipbuilding Market Worldwide in 2025: Market Research Report (2024–2035),” (August, 2025). https://www.sphericalinsights.com/blogs/top-50-companies-in-shipbuilding-market-worldwide-in-2025-market-research-report-2024-2035.
[24] United Nations Trade and Development (UNCTAD), Review of Maritime Transport, p. 54, https://unctad.org/system/files/official-document/rmt2025ch2_en.pdf
[25] UNCTAD, Maritime and other transport, Data insights, https://unctadstat.unctad.org/insights/theme/107
[26] United Nations Trade and Development (UNCTAD), https://unctadstat.unctad.org/insights/theme/107
[27] “Revelation from Shipbuilding: The Power of Cycles”, Golden Pine Investments, https://www.goldenpineinv.com/en/single-post/revelation-from-shipbuilding-the-power-of-cycles
[28] Ibid.
[29] United Nations Trade and Development (UNCTAD), Review of Maritime Transport, p. 46, https://unctad.org/system/files/official-document/rmt2025ch2_en.pdf
[30] “South Korean Shipbuilders Eye Overseas Production as Domestic Yards Reach Capacity”, Hellenic Shipping News, 18 February 2025, https://www.hellenicshippingnews.com/south-korean-shipbuilders-eye-overseas-production-as-domestic-yards-reach-capacity/
[31] Nikolaos Tagoulis, “India’s market share in the global shipbuilding”, Breakwave, 19 February 2025, https://www.breakwaveadvisors.com/insights/2025/2/19/indias-market-share-in-the-global-shipbuilding


Leave a Reply
Want to join the discussion?Feel free to contribute!