Keywords: Data Analytics, Big Data Analytics, Big Data, Maritime Data, Blue Economy, Blueing the Economy, Marine Spatial Planning, HADR.
Building upon the previous overview of data analytics (DA) of India’s maritime data, this article seeks to contextualise DA to a specific source of maritime data, namely, the National Database of Coastal Shipping (NDCS).
At the outset, it is encouraging to see that the use of DA has been explicitly addressed in the Draft Coastal Shipping (Strategy and National Database) Rules, 2026 (hereinafter referred-to as “the Draft Rules”).[1] Rules 15(4)(c)-(d) of the Draft Rules stipulate that the “functional requirements” of the NDCS will include (among other things) “interactive dashboards to monitor trends in coastal trade and compliance alerts,” and “predictive analytics for port security, congestion management, berth allotment, and supply chain optimisation.”
As they currently stand, the Draft Rules appear to limit themselves to predictive analytics alone. Yet, as has been emphasised earlier, DA can do much more than make predictions. In addition, while the Draft Rules do mention four thematic focus areas for DA (namely, port security, congestion management, berth allotment, and supply chain optimisation), it remains inadequately specific on the precise content of these themes.
Consider, for example, the optimisation of India’s supply chain(s) as a thematic focus area for DA. DA can be used for a wide (and growing) variety of objectives and functions in the context of supply chain(s) — forecasting demand, assessing risks, scheduling processes, planning and managing inventories, optimising routes, predicting supplier performance and maintenance needs, strategising pricing, etc.[2] Accordingly, it is important to identify specifics in this regard, not least because the mathematical models deployed in DA will require specification of objectives more detailed than simple optimisation. The Draft Rules are also silent on some other policy-relevant specifics, such as the kind(s) of “trends in coastal trade” that are required to be monitored.
In the absence of clarity about such specifics, the implementation of the NDCS is likely to remain inadequate, preventing it from realising its full potential. Accordingly, it is pertinent to outline such information, and to thereby inform the implementation of some of these aspects in (and outside-of) the immediate context of the NDCS. The succeeding paragraphs also examine how the Government of India (including, but not limited to the Ministry of Ports, Shipping, and Waterways [MoPSW]) may use DA for two focus areas identified in the Draft Rules – the optimisation of India’s supply chain(s), and the management of congestion in/around India’s ports.
DA for Supply Chain Optimisation
As mentioned above, the optimisation of India’s supply chain(s) involves working along multiple axes, such as the reduction of cost(s), the reduction of emissions and fuel consumption, the optimisation of routes, etc. Perhaps the most important component of such optimisation is the reduction of costs, particularly administrative costs. One way in which this can be done is through an integration between multiple digital tools and platforms that inform one another. Consider the World Food Programme (WFP), which claims to operate the “world’s largest humanitarian supply chain” and uses multiple digital platforms and tools to allow and augment “cost-efficient decision making” across it, as summarised in Table 1:[3]
| Platform | Maturity or Uptake | Intended purpose | Example (from documented evidence) of use for intended purpose |
| LESS (Logistics Execution Support System) | Mature (2014) | A tool for digitalised accounting of centralised data, improved visibility and reporting. WFP’s global system for managing the physical movement of food from arrival at a port/ hub to the final delivery point | Strategic investments in emergency preparedness, including advance financing and strategic pre-positioning |
| LESS (Last mile) | Piloted in 2023 but uptake by partners is less than 50% | Mobile App that enables the real-time recording of Waybill receipts at WFP Cooperating Partner sites all over the world. WFP’s LESS (Last Mile) is a specialised mobile extension of the main LESS system, designed to streamline the final leg of aid delivery, from local warehouses or Cooperating Partner sites directly to beneficiaries | Collaborating with cooperating partners to reduce delivery costs and improve programme cost-efficiency |
| Optimus | Recent (2019-22) | A tool to identify cost-efficient methods for improving ration quality and supporting optimised commodity choices at a country-level. Optimus is an online decision support system (DSS) developed by the WFP’s Supply Chain Division, which helps identify the most efficient and cost-effective way to reach affected populations. Building on data from dozens of sources, mathematical models provide key insights into food-basket design, sourcing strategies and delivery networks for any WFP operation | Reviewing planned food-basket to increase nutritional adequacy, support local and regional procurement priorities, and maximise value for money |
| SCOUT | Recent (2023-24) | Automatically generates optimised global and regional plans and provides strategic analysis for decisions on what, where, and when, to buy, store, and deliver. SCOUT uses optimisation and AI to enhance global food-sourcing and delivery planning for WFP’s supply chain. It optimises complex supply chain planning by modelling WFP’s global supply chain network, focusing on upstream operations up to recipient countries. It also provides data-driven insights to improve decision-making in sourcing and delivery planning for HQ core units and regional bureaus | Seizing harvest opportunities during the harvest season to reduce costs and minimise off-season purchases (as done in WACARO in 2024-25) |
| PRISMA | Rolled-out in 2024 | A supply-chain visibility tool, providing real-time insights for planning and risk anticipation. PRISMA is a supply-chain control tower, empowering WFP operations with key descriptive, predictive and prescriptive analytics to support upstream and downstream supply planning and forward-looking risk anticipation. It enables smoother and more efficient evidence-based operational decisions | Suggests stock movements within a country to maximise demand coverage, prioritise batches with approaching BBD for distribution, simulate changes in demand or supply disruptions to enable scenario planning |
| ECODASH | Piloted in 2024 | WFP’s internal carbon-accounting tool, aimed at supporting optimised environmental impact. Basically, the dashboard aims at tracking and reducing emissions and waste across its supply chain operations by analysing data on carbon emissions and waste operations from sourcing, logistics and delivery options | Country office initiatives for improving supply-chain waste-management and reducing greenhouse gas emissions |
Table 1: WFP’s Digital Platforms for Cost-efficient decision making.
Source: World Food Programme (2025)
The NDCS, too, may need to be integrated-with or supported/supplemented-by other digital platforms or services. An illustrative Indian example in this regard is the ‘Anna Chakra’ tool being used for optimising the supply chain(s) associated with India’s public distribution system (or PDS). It has been implemented by the Department of Food and Public Distribution (Ministry of Consumer Affairs, Food and Public Distribution, Government of India) and developed in collaboration with the World Food Programme (WFP) and IIT Delhi. It uses DA to identify optimal inter-state routes for the movement of food grain across India’s PDS supply chain nodes. Official estimates are that it saves transportation costs of about INR 250 crores (over US$ 25 million) on an annual basis.[4] These savings are undoubtedly helped by the fact that the tool has been integrated with other relevant digital platforms like the Freight Operations Information System (FOIS) portal of the Indian Railways, and the PM Gati Shakti platform which, among other data, also houses the geo-locations of relevant PDS supply chain nodes across Indian states.[5]
A second objective of supply chain optimisation on the NDCS ought to be profit maximisation, and an overall enhancement of value-creation by Indian businesses, especially MSMEs. Indian MSMEs have limited resources and expertise; accordingly, they stand to gain substantially from access to/guidance from the DA implemented in the NDCS.[6]
Thirdly, it is desirable to deploy and configure sensors (such as IoT sensors) at identified supply-chain nodes or locations, whether in India’s coastal shipping network or in her larger logistics ecosystem. The data generated by these sensors will provide an additional and very valuable source of data that can be used as input(s) for DA. For instance, the MoPSW could mandate the installation of a Fuel Optimisation System (FOS) on ships, which gathers data using equipment and software installed aboard the vessel and thereafter reports it to the regulators.[7] The use of “digital twins” is another feature that merits active consideration.
Table 2 lists some DA methods that are commonly used in predictive analytics for supply chain optimisation:[8]
| Method | Best for | Data needed | Complexity | When to use |
| Moving averages | Stable demand patterns | 12+ months of historical data | Low | Mature products, steady markets |
| ARIMA / SARIMA | Seasonal demand | 2+ years of data (with seasonality) | Low-Medium | Retail, Consumer Packaged Goods, anything with clear cycles |
| Linear regression | Understanding drivers of cost or demand | Structured tabular data | Low | Price sensitivity, promotion-impact |
| Random Forest / XGBoost | Complex, non-linear patterns | Moderate structured data | Medium | Multi-variable demand, risk scoring |
| STM/neural networks | Large-scale, real-time signals | Large datasets, IoT streams | High | Real-time logistics, sensor-heavy environments |
Table 2: Common DA methods used in Supply Chain Optimisation
Source: “Predictive Analytics in Supply Chain: A Practical Guide”
The next section examines DA for the management of congestion at/around India’s ports.
DA for congestion management
While the Draft Rules do not specify this, it appears that the congestion referred to in Rule 15(4)(d) is the congestion at Indian ports. Accordingly, this issue is briefly explored in the succeeding paragraphs.
Port congestion is a global challenge, and India is no exception. It has been described as a “persistent source of freight rate increases and volatility,” and as “a well-known inefficiency at all levels of the shipping sector.”[9] Further, it can cause — and can be caused by — disruptions in the supply chain. Supply chain measures (such as the optimisation of shipping routes and management of inventory) accordingly provide clear strategies to address port congestion, and thus, the DA catering to supply chain optimisation must feed into the DA addressing port congestion.
While port congestion at Indian ports is the result of multiple factors, several of these can nevertheless be monitored by integrating existing data-sources into the DA performed under the Draft Rules (and eventually on the NDCS). The table below explains this in the specific (illustrative) context of “weather and ocean conditions” as one of the causes of port congestion:
| Cause of Port Congestion | Existing data source(s) and feed(s) to address the cause | Web links |
| Weather | Forecasts and warnings by the India Meteorological Department (IMD) | https://rsmcnewdelhi.imd.gov.in/port-warning.php
https://mausam.imd.gov.in/responsive/coastal_forecast.php https://nwp.imd.gov.in/sea_area_rsmc.php https://mausam.imd.gov.in/responsive/marine_forecast.php https://mausam.imd.gov.in/responsive/coastal_observations.php |
| Ocean conditions | Forecasts and ocean observations by the Indian National Centre for Ocean Information Services (INCOIS) | https://incois.gov.in/site/services/osf.jsp
https://incois.gov.in/OON/index.jsp
|
| Ocean conditions | Forecasts and Data by the Meteorological and Oceanographic Satellite Data Archival Centre (MOSDAC) (Dept. of Space, Govt. of India) | https://mosdac.gov.in/ |
Table 2: Existing Data Sources and Feeds for Data Analytics
Source: Author
Other causes of port congestion — such as vessel-bunching, port infrastructure and operations, inland connectivity, etc. — can be similarly addressed through existing data sources and feeds from the Sagar Manthan Portal (made for performance-monitoring) and the NLP-Marine (made for India’s logistics sector).[10] However, successful integration of these sources and feeds will require further technical work involving the cleaning, standardisation, and harmonisation of data and metadata.
Closing Thoughts and Early Recommendations
Under the System of National Accounts 2025 (the international statistical standard for national accounts statistics), an economic asset is “[a] store of value representing an economic benefit or series of economic benefits accruing to the economic owner by holding or using the item over a period of time. It is a means of carrying forward value from one accounting period to another.”[11] When seen against this definition, India’s maritime data (including on the NDCS) can be seen as a clear economic asset for the country. The Secretary (MoSPI) expressed similar views in April 2026.[12]
On the NDCS in particular, two closing thoughts are outlined here. First, the NDCS should not be implemented as a standalone database for India’s shipping regulators alone. If it is able to draw upon data from other relevant, existing digital platforms like the Sagar Manthan portal and Sagar Setu/NLP-Marine portal, it will be able to function, quite like the Anna Chakra, as an integrated node in a larger pan-India network and ecosystem.
Second, many of the tools and techniques required for effective DA on the NDCS are available in the public domain. Very little in this regard is beyond the reach of the GoI or the DG (Shipping)/DG (Maritime Administration), whether due to proprietary reasons or otherwise. However, the implementation of effective DA on the NDCS – and the realisation/extraction of value from the data therein – will nevertheless demand time and effort. Among other things, it will require that India’s maritime data is seen as a strategic, economic, and sovereign Indian asset. As such an asset, many of its underlying features – quality, standardisation, harmonisation, interoperability, etc. – which are constitutive policy choices, are presently mostly left to be determined by the private sector. As recently indicated by MoSPI, these aspects must hereinafter be seen and executed as a “national priority.”[13] To sum up, DA on the NDCS will demand strong data foundations in the NDCS.
Early Recommendations
Some early recommendations are outlined below in light of the analysis thus far.
- The use of predictive analytics by the Port of Hamburg (noted approvingly by Maritime India Vision 2030 or MIV 2030), which is schematically depicted in Figure 1, should be studied in granular detail.[14]
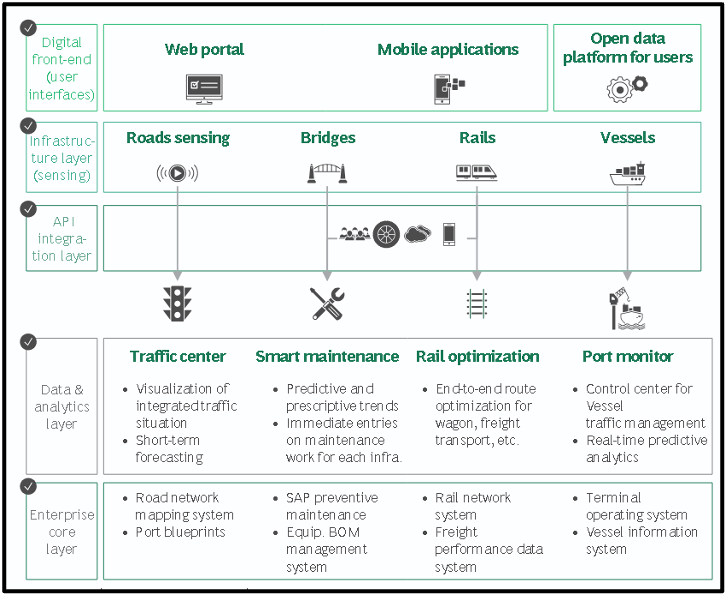 Fig 1: Integration of multiple layers at the Port of Hamburg
Source: MIV 2030
It is presently unclear if the NDCS when fully implemented will be able to replicate a comprehensive approach like this one. As noted by Secretary (MoSPI) at the 2026 edition of the “National Deliberative Summit for Harmonising Administrative Data for Governance”, India needs to break her data silos and promote standardised and interoperable data. He also highlighted the need for structured data.[15] In this regard, the MoSPI note circulated prior to the Summit is instructive, as may be seen from the following extract:
“Administrative datasets have mostly been designed for a single purpose: operational management…. The data served its purpose within the department. The reuse of data was not so much on the horizon especially when produced by a different department. With the changing priorities, policymakers are now asking cross-cutting question…These questions cannot be answered from any single department’s data or a dashboard. They require linked data from multiple sources enabled for advanced analysis. And [data] analytics readiness requires harmonisation… A second, equally important shift is the arrival of AI and automated analytical systems. AI tools, unlike human analysts, cannot infer missing context, work their way through inconsistent definitions, or work around undocumented changes in data structure. They require explicit metadata, stable data models, and machine-readable provenance. Data that is perfectly adequate for a human analyst reading a report may be completely unusable by an AI system trying to answer a policy question.”[16]
- As discussed earlier in this article, the success of the NDCS will depend primarily on the quality and standardisation of its data, and not so much on the sophistication of the DA applied thereupon. NITI Aayog too recently noted that India’s digital governance will “only be as strong as the quality of the data that powers it, [and that] data quality must become a national priority – on par with infrastructure and platforms.”[17] Consequently, it is recommended that Rule 21(3) of the Draft Rules (which empowers the DG (Shipping) to “specify the frequency, format, and validation procedure for updating or verifying data” on the NDCS should be invoked to mandate the collection of quality data (as opposed to mere documents or PDF files) that is structured, machine-readable, and standardised.
- In the context of the optimisation of India’s supply chain(s) and the management of congestion in/around India’s ports, policymakers are likely to prefer diagnostic and prescriptive DA which can inform timely decisions relating to berth-allocation, routes, and the positioning of inventory. However, the draft rules, in their present form, appear to commission/demand predictive DA alone. Consequently, it is reiterated that the NDCS should be mandated (under the Rules) to support all four kinds of DA, and not predictive analytics alone.
- As mentioned in the beginning, the Draft Rules are silent on the kind(s) of “trends in coastal trade” that are required to be monitored. This article specifies that the following trends in coastal trade are relevant to India (and Indian policies), and consequently ought to be monitored through the interactive dashboards on the NDCS:
- The volume of coastal cargo, by commodity and by route, over time.
- The modal share of coastal shipping against inland (road and rail) transport.
- The seasonal trends in coastal cargo.
- The concentration of coastal-shipping traffic.
- Finally, several recommendations made in MIV 2030 deserve reproduction here because they are directly relevant to the NDCS.
- For the optimisation of non-working hours at a berth, MIV 2030 identified “equipment preventive maintenance” as a good practice.[18] It also identified predictive maintenance of port assets as a “must-have” for Indian ports.[19] Consequently, these aspects ought to be covered by the DA on the NDCS.
- MIV 2030 noted that data on ship operations and repairs can be used to create predictive maintenance schedules, and assess evolving requirements for spare parts that may be communicated to the relevant ancillary industries. (Centres of Excellence on Ship Repair were to use data in this way so as to create a “strong and sustainable ancillary industry” for ship repair).[20] Accordingly, the NDCS too can use its data for such purposes. Indeed, this is an example of how the NDCS can be more than mere regulatory tool.
- MIV 2030 noted how DA can be used for creating “personalised risk profiles” for Indian ports and their customers.[21] This article adds that DA on the NDCS can be used to create such customised risk profiles for India’s coastal states, and other relevant Indian actors like (say) women-led collectives in fisheries and Fish Farmer Producer Organizations (FFPOs).[22]
******
About the Author
Mr Mayank Mishra is a litigator and researcher. He has a background in technology and has worked extensively in India’s social sector. Presently, he is a Senior Associate Fellow within the PIML cluster of the NMF. Before re-joining the NMF in January 2026, he was a legal consultant at a Centre of Excellence established by the Research and Information System for Developing Countries (RIS) and the Ministry of Ports, Shipping and Waterways (MoPSW) of the Government of India. He may be reached at law9.nmf@gmail.com
Endnotes:
[1] Ministry of Ports, Shipping and Waterways (Govt. of India), “The Draft Coastal Shipping (Strategy and National Database) Rules, 2026,” https://share.google/sL9CXGliD1fgbBumz
[2] Uchenna Evans Anoruo, “Optimizing Supply Chain Operations Using Predictive Analytics and Operations Research Techniques: A Comprehensive Analysis of Contemporary US Industrial Applications”, IRE Journals 7, No 4 (October 2023), 699, https://www.irejournals.com/paper-details/1709381
See also: “Predictive Analytics in Supply Chain: GAINS Tips to Boost Efficiency & Reduce Risks,” 22 July 2025, GAINS, https://gainsystems.com/blog/predictive-analytics-in-supply-chain/
See also: Hema Madhavi Kommula, “The Role of Predictive Analytics in Enhancing Supply Chain Resilience”, World Journal of Advanced Engineering Technology and Sciences 15, No 1 (2025), https://doi.org/10.30574/wjaets.2025.15.1.0392
See also: “How Predictive Analytics is Transforming the Supply Chain”, 31 March 2026, Z2Data, https://www.z2data.com/insights/how-predictive-analytics-is-transforming-the-supply-chain
[3] United Nations World Food Programme, “Strategic Evaluation of WFP’s Supply Chain Strategic Roadmap (2022–2025): Centralized evaluation report Volume I,” December 2025, 25, https://doi.org/10.71958/wfp131315
See also: Beverly Sithole et al, “Supply chain optimization: enhancing end-to-end visibility,” Procedia Engineering 159, (2016), https://doi.org/10.1016/j.proeng.2016.08.058
[4] Government of India, Department of Food and Public Distribution, Ministry of Consumer Affairs, Food, and Public Distribution, “Enhancement of Transparency in PDS,” Sansad, 10 December 2025, https://sansad.in/getFile/loksabhaquestions/annex/186/AU1801_6AuNrc.pdf?source=pqals
[5] Government of India, Ministry of Consumer Affairs, Food & Public Distribution, “Shri Pralhad Joshi Launches ‘Anna Chakra’, the Public Distribution System Supply Chain Optimisation Tool and SCAN (Subsidy Claim Application for NFSA) Portal”, Press Information Bureau, 05 December 2024 https://www.pib.gov.in/PressReleseDetailm.aspx?PRID=2081277®=3&lang=2
[6] Abdul Jabbar et al, “The Interplay Between Blockchain and Big Data Analytics for Enhancing Supply Chain Value Creation in Micro, Small, and Medium Enterprises,” Annals of Operations Research 350, (2025), https://doi.org/10.1007/s10479-024-06415-5
See also: Xiaoyan Teng et al, “Research on the Relationship between Digital Transformation and Performance of SMEs,” Sustainability 14, No 10 (2022), https://doi.org/10.3390/su14106012
[7] “Indian Coastal Shipping Programme,” DG (Shipping), 39, https://www.dgshipping.gov.in/WriteReadData/userfiles/file/DNV%20Report.pdf
[8] “Predictive Analytics in Supply Chain: A Practical Guide,” 20 April 2026, Knime, https://www.knime.com/blog/predictive-analytics-supply-chain-practical-guide
[9] “Review of Maritime Transport 2025,” 75, 104.
See also: “Port congestion, Waiting Times and Operational Efficiency,” December 2024, UMAS, https://www.u-mas.co.uk/wp-content/uploads/2024/12/Port-Congestion-Report-v1.8.pdf
See also: Andras Komaromi et al, “Supply Chains and Port Congestion Around the World,” IMF Working Paper (March 2022), 3, 14-15, https://doi.org/10.5089/9798400202957.001
See also: M Can Fidan, “Navigating Global Port Congestion: What North American Exporters Need to Know in 2025”,12 March 2025, More Than Shipping, https://www.morethanshipping.com/navigating-global-port-congestion-what-north-american-exporters-need-to-know-in-2025/
See also: Verónica Veleda and Anna Díaz Llop, “Port congestion explained: why delays happen and how to mitigate them,” 18 February 2025, ALG, https://www.alg-global.com/blog/maritime/port-congestion-why-delays-happen-and-how-mitigate-them
[10] “Shri Sarbananda Sonowal inaugurates ‘Sagar Manthan’, the Real-time Performance Monitoring Dashboard of Ministry of Ports, Shipping and Waterways (MoPSW),” 23 March 2023, Press Information Bureau, https://www.pib.gov.in/PressReleasePage.aspx?PRID=1910063®=3&lang=2
See also: “Shri Sarbananda Sonowal Inaugurates National Logistics Portal-Marine, a Single Window Logistics Portal to reduce the logistics cost,” 27 January 2023, Press Information Bureau, https://www.pib.gov.in/PressReleaseIframePage.aspx?PRID=1894117®=3&lang=2
[11] “System of National Accounts 2025,” United Nations, Clause 11.10, https://unstats.un.org/unsd/nationalaccount/docs/2025_SNA_Pre-edit.pdf
[12] “MoSPI conducted National Deliberative Summit on “Harmonizing Administrative Data for Governance” during 29-30 April, 2026 in Bhubaneswar, Odisha,” 30 April 2026, Press Information Bureau, https://www.pib.gov.in/PressReleasePage.aspx?PRID=2256932®=3&lang=2
[13] Ministry of Statistics and Programme Implementation (Govt of India), “Using Administrative Data for Governance: Harmonising Departmental Data at the State/UT Level,” April 2026, 5, https://share.google/xQO7dQowcKbqDJItI
[14] “Maritime India Vision 2030,” Ministry of Ports, Shipping and Waterways, 114, https://shipmin.gov.in/en/content/maritime-india-vision-2030
[15] Press Information Bureau, “MoSPI conducted National Deliberative Summit on “Harmonizing Administrative Data for Governance” during 29-30 April, 2026 in Bhubaneswar, Odisha.”
See also: Hema Madhavi Kommula, “The role of predictive analytics in enhancing supply chain resilience,” World Journal of Advanced Engineering Technology and Sciences 15, No 1 (2025), 1764, https://doi.org/10.30574/wjaets.2025.15.1.0392
[16] Ministry of Statistics and Programme Implementation (Govt of India), “Using Administrative Data for Governance: Harmonising Departmental Data at the State/UT Level,” April 2026, 9-10, https://share.google/xQO7dQowcKbqDJItI
[17] Niti Aayog, “India’s Data Imperative: The Pivot Towards Quality,” June 2025, 1, https://niti.gov.in/sites/default/files/2025-09/india-data-imperative-the-pivot-towards-quality.pdf
[18] MIV 2030, 84.
[19] MIV 2030, 115.
[20] MIV 2030, 162.
[21] MIV 2030, 112.
[22] “Fish Farmer Producer Organisation,” 17 March 2026, Press Information Bureau, https://www.pib.gov.in/PressReleasePage.aspx?PRID=2241160®=48&lang=2
See also: “Advancing India’s Fisheries Sector: Institutions, Investment, and Inclusion,’ 06 April 2026, Press Information Bureau, https://www.pib.gov.in/PressReleasePage.aspx?PRID=2249228®=48&lang=2


Leave a Reply
Want to join the discussion?Feel free to contribute!